Friday, July 1, 2016

Summer mix

     I am reminded in June annually that by far my favorite thing in the world of wildlife that I have seen firsthand is colored-up cutthroat spawning in a mountain stream that is clear enough to be able to watch all of their social interactions. Never mind the fishing part of it. Completely unnecessary, and in my opinion somewhat on the invasive side when that is the scenario.  This is the early-summer sweet spot of the year when a lot of my time is spent in the presence of such activity, and it's now more than ever that I remember how ridiculously lucky I am to have the job that I have. Next week, I get to go take a three-day pack trip to one of the most remote and beautiful alpine lakes in the state, collect eggs from the spawning cutthroat there, and deliver them to our hatchery in Glenwood where they are raised into the broodstock that then produces the eggs for all the alpine lake stocking that we do on the western slope (minus the San Juan River drainage). I mean, could there possibly be a more enjoyable work assignment than that? When I'm standing next to a stream full of spawning cutthroat in some jaw-dropping setting, I feel like I won the lottery. So thank you, from the bottom of my heart, for buying a Colorado fishing license.

     From time to time, when an interesting scientific paper comes out, I'll discuss aspects of it here. The Idaho folks have put out one of the best lake trout studies in recent years, describing work they've done in Priest Lake. It was recently published in the North American Journal of Fisheries Management. One of the great things about this study was that they collected one of the biggest age-growth data sets (628 fish) for a lake trout population that I have seen, shown below.
    Priest Lake is similar to Granby in its food web, with lake trout, kokanee, and mysis shrimp all introduced at different times. Also like Granby, there is a negative relationship between the size of lake trout and their body condition, suggesting that food availability becomes a limiting factor as the fish get larger, and that the lake is overloaded with large predators that do not have an adequate forage base available.
     The most striking thing to me when looking at this data set is the degree of variability. The solid line describes the average, or typical, length for a given age. I think that often, once you slap that line on a graph, your eye is drawn to it and it's easy to forget to consider the other information contained in the figure. Using the equation that describes the line, which is in the lower right hand corner, it tells us that a 10-year old lake trout is 498 mm, or 19.6 inches. A 20-year-old is 636 mm, or 25 inches, and a 30-year-old would be 709 mm, or 27.9 inches. In fact, based on the equation, it would in theory take 47 years to produce a 30-inch fish, and no fish in the lake would ever reach 40 inches. But that's obviously not the case. The reality is that there are fast growers and slow growers. The 31-year-old age group ranged in size from about 21 inches to about 40 inches. The  20-year-old age group ranged from about 18 inches to about 35 inches. So you may catch a 31-year-old fish that is 21" and you may catch a 20-year-old fish that is 35". I think that we all tend to overlook this degree of variability when thinking about lake trout growth rates.  It appears to me that what's going on here is similar to what we see at Granby -- beyond 24", you're really talking about two populations of fish. You have the ones who make the prey switch to vertebrates, and the ones who, for whatever reason, never make that switch and just stop growing, seemingly perfectly content to just keep eating mysis for their entire lives. It's maybe even a little misleading to apply one growth curve to this population. At 600 mm, or 24", it should really split out into two, one describing the growth of the fish who made the prey switch and one describing the fish that did not. You can see right where those two curves would be, and there's even kind of a blank space in between the two groups on the right half of the graph.
     The problem is, in order to produce such a data set, you would have to run stable-isotope analysis on each of the 628 fish that were aged here, which tells you what the fish preferred to eat throughout its life. Then you would be able to assign the fish into two groups, the vertebrate predators and the mysis eaters. That wasn't the point of this study, and it would become pretty expensive. It was a huge amount of work just to age this many fish - in order to age lake trout you have to prepare the otolith by setting it in epoxy, and then sectioning it with a saw, cutting very thin slices through it in order to be able to read the annual rings. There is a reason why it is very rare to see an age-length data set that is this large. Anyway, the Idaho folks did a great job on that study and there are a lot of interesting things in their paper.

    I've spent a lot of days on lakes over the past 8 weeks. Wolford, then Granby, which I talked about last post. Then a couple days on Shadow Mountain (my least-favorite lake of all time), followed by 5 days on Williams Fork. We ran the most intensive gillnet survey that's ever been done on Williams Fork, with 40, six-hour gillnet sets, making for 240 total hours of gillnet soak time. Then a couple days on Dillon.
     Williams Fork was a lot of fun and I learned a lot. The biggest laker we picked up there was 39" and weighed 35 3/4 lbs. It was very similar to the last really big laker we handled at WF, in 2013. That one weighed 36 pounds and is the heaviest fish I've ever netted at Williams Fork. So this one was the second-heaviest by a quarter of a pound. Here's a pic of this year's big fish:

     That fish has a body condition factor of 132, if you're curious. I'll discuss that further below, and on the relative weight plot for this survey, you can see how outstanding this fish is compared to the general population.
     The second biggest lake trout we picked up, a 25-pounder, had two recently eaten, partially digested lake trout that were both about 16" sticking out of its stomach. The coolest thing about that was that one of those lakers had a full stomach that was still intact and packed full of recently-eaten crayfish. So a nice picture of three levels of the food web here:


    Williams Fork is experiencing a nice peak in crayfish production right now for whatever reason and you can see it benefitting the whole food web. Many smaller lake trout had stomachs very full of crayfish. Actually, I shouldn't say "for whatever reason" because I think it's a response to drawdown that occurred as a result of the 2012 drought. When the reservoir refills after a drought period, we tend to see a "new reservoir effect" that creates a surge in productivity for the next few years, and you can watch that surge work its way through the food web.
     WF is always a decent crayfish lake but it does seem to behave in somewhat of a cyclical manner. Hopefully this also means it's a good zooplankton year. I certainly saw a lot of daphnia kicking around in the water just looking down into it. We could really use a rebirth of the Williams Fork kokanee run about now. It was nice to see that fish that's pictured above, because it is an example of the food web "bypassing" the traditional kokanee prey base. If that is going on a lot, and we've got good zooplankton production right now, maybe that's good news for a recovery of kokanee numbers.
     Here's a 12-pounder that we picked up out on the flats that had recently eaten a kokanee that ran about 13":


     You may remember that we liberalized lake trout bag limits at Williams Fork in 2011, to allow for an 8-fish bag and no more than one fish over 30". We also liberalized the bag limit at Green Mountain, which I've discussed in previous posts. But we did not include the one-over-30 provision at GM. I am looking at this as a kind of a paired experiment to see if the one-over-30 regulation produces any differences that we can see in the lake trout population over time. My hypothesis is that lake trout anglers so rarely harvest fish over 30", let alone more than one of them, that it makes no difference whether or not a lake includes that restriction. So now, I have a data set from each lake, Green Mountain in 2015 and Williams Fork this year, both of which involved the exact same amount of effort - 40, six-hour net sets in randomly selected locations. The reason why these data sets are from consecutive yeras rather than the same year, is that I run the surveys at the same time on the calendar. It takes 5 days to run a 40-net survey, and I don't have 10 days to devote to just these two lakes every year. But I can commit to 5, hence the every-other-year schedule that I'm on now. 
     We can now start to look at those data sets to see if we can detect any differences. Here are the length-frequency histograms for the two lakes:


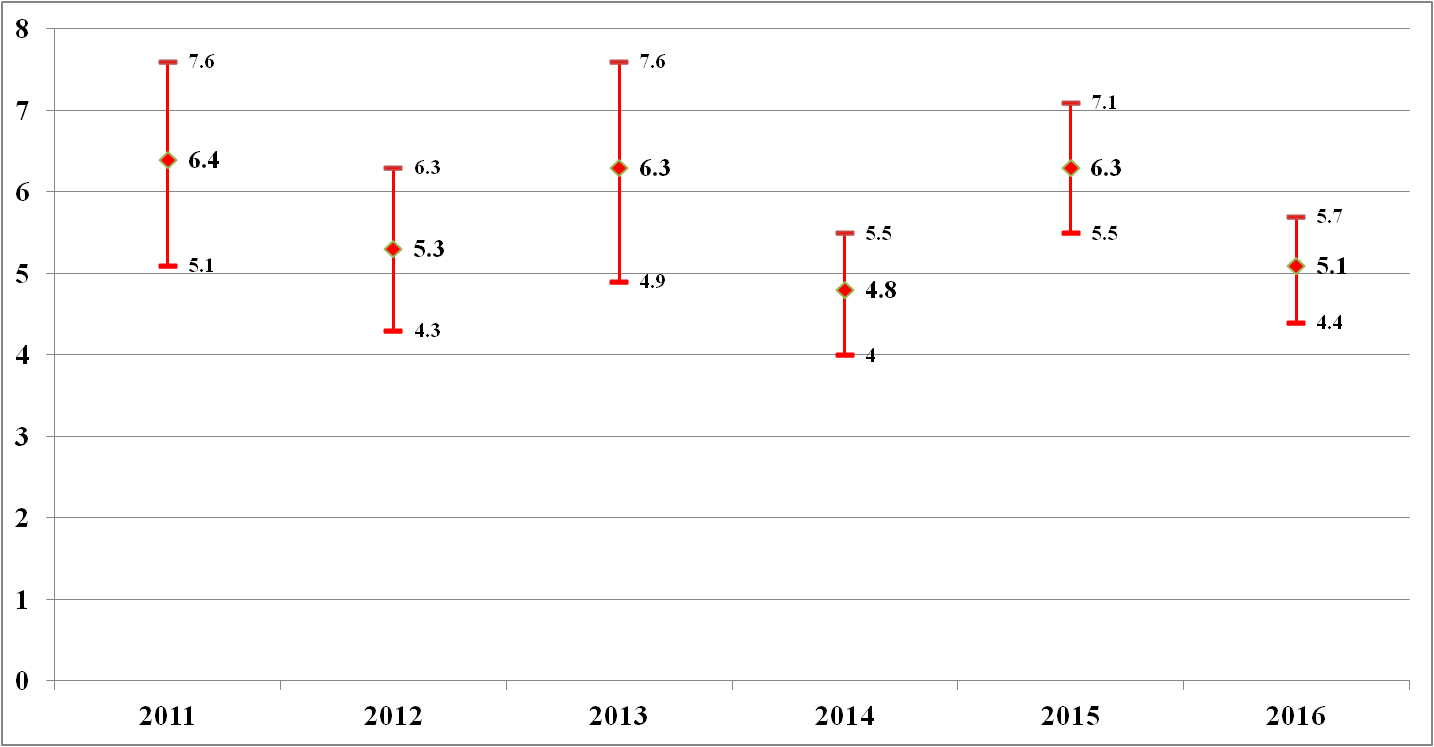
     The most common size of fish at Williams Fork was 11", while the most common size at GM was 15".  The total number of lake trout we captured at WF was 122, while Green Mountain yielded 86 fish. With 80% confidence intervals, those catch rates look like this:


     Not much overlap there. We can apply a simple t-test to see if there is a significant difference between these two data sets. This yields a p-value of 0.14, suggesting that there's an 86% chance that the two lakes have different densities of lake trout. Plenty of evidence for me to say that Williams Fork currently has a higher density of lake trout than Green Mountain. Is this a result of the difference in the regulations?
     Because the difference in the regulation involves fish over 30", what can we say about that? In 2015, at Green Mountain we captured 12 fish over 30". At Williams Fork this year we caught 5. Put another way, at Green Mountain it took an average of  20 hours of gillnet soak time to pick up a fish over 30", while at Williams Fork it took an average of 48. This suggests that the density of fish larger than 30" is higher at Green Mountain, which is the opposite result that you would expect given the regulation. 
     Let's look at relative weights between the two lakes. Here are the relative weight plots by size. The axes on these graphs are the same for easy comparison.


     Green Mountain is showing a greater increase in body condition as fish get larger. That is, the slope of the trend line is steeper, as illustrated by the equation. However, the reason for this is not that the large fish are in better shape at GM. It's because the small fish are in better shape at Williams Fork. That is why the intercept value in the Williams Fork equation is higher. This can be seen in the table below, which displays body condition for fish on either side of the 24" mark:

Green Mountain 2015
Williams Fork 2016
<24”
72.1
79.1
>24”
95.7
96.6


     You can see that the difference here is that small fish at Williams Fork were in significantly better condition. Again, this is a direct reflection of the good crop of crayfish currently in the reservoir. The condition of the large fish is essentially the same between the two lakes.      
     All right, time to wrap it up. Bottom line is that so far, there is no evidence that the one-over-30 regulation at Williams Fork is resulting in any differences in the lake trout population that I am able to detect in comparison with Green Mountain. We'll see what the future holds. There are currently a ton of small lakers in Williams Fork, and I think that people aren't harvesting them because a 12" lake trout isn't nearly as desirable to harvest as one that's in the 16-22-inch range. But it sure wouldn't hurt anything if people were willing to harvest a bunch of those 10-12-inch fish. 
     Please be sure to use the comment section to mention topics you'd like to see me address. I suspect people are tired of hearing about lake trout and it's time to turn  to other subjects. Let me know what those other subjects should be, and thanks for your interest.

Wednesday, June 1, 2016

Granby spring nets

     We spent four days recently running our annual gillnet survey at Granby. We had good luck with the weather, for the most part dodging the standard Granby afternoon wind-rodeos. May 19, 23, 24, & 25 were the days that we were out there.  We set 32 gillnets in randomly selected locations for six hours each. Although the 32 locations are randomly selected, we use the same points (or as many of them as possible) every year to give us valid comparisons over time. This was the sixth year that we have run this survey. 
     The average lake elevation across those four days was 8,262, or 18 feet below full pool. This was 12 feet lower than when we ran this survey last year. The average lake elevation for the previous five years when we have run the survey is 8,256, or 24 feet below full.
     Average water temperature was 45.4. The temperature during the survey over the previous five years has averaged 48.2, so the lake is a little on the cool side so far this spring.
     If you haven't figured it out yet, this is going to be a stats-heavy discussion. One of the reasons that I am proud of this data set is that you can look at it from many different analytical angles, many of which are somewhat independent of each other. I will offer the caveat up front though, that my statistical understanding and abilities lie more or less at the undergraduate level.  Statistical analysis is one of the things that I enjoy most about my job, but my skills lie firmly in the classical, parametric, nuts-and-bolts utilitarian realm rather than the advanced and highly complex world of Bayesian or other approaches found in the scientific literature these days.  So I am by no means a Statistical Titan. The reason I'm pointing this out is that if any stat-heads out there see fatal flaws or additional approaches that I'm not making use of -- by all means, please point that out to me and let's have the discussion. If you're a license buyer, I collect this information on your behalf, and let's get the most that we possibly can out of it.
     So -- the purpose of this survey, and this approach, is to be able to detect trends in the lake trout population. Is the population increasing, decreasing, or remaining static? Also, is the size structure of the population changing? Thirdly, what does the condition of the fish that we capture tell me about the condition of the prey base? 
     Because lake trout populations experience change slowly -- much more slowly than riverine trout populations -- changes from one year to the next are less instructive than long-term trends that only become apparent over years or even decades. This type of long-term change is exactly what this data set is designed to detect. I regularly hear anecdotal reports that the density of lake trout in Granby seemed to be much higher in the '80's -- which I don't doubt, but I have no data, no standardized survey, that was conducted in the '80's that I can repeat precisely. That is frustrating. Going into future decades, none of my successors will experience that frustration. 
     Now for some results. I haven't analyzed things to the fullest extent possible yet. The time for that is during the winter. However I do run some of the main analyses right away because I'm anxious to see what things are looking like. The first one is in the graph below, which displays average number of lake trout caught per net across the 32 net sets. The 80% confidence interval is included in the graph. If you're not familiar with confidence intervals, this is the calculation that determines that if you were to run 1,000 net sets instead of 32, 800 of them would fall within that interval. 

    In 2011 and 2012, we ran 30 nets. In order to tighten up that confidence interval, I added two nets and settled on 32 as the permanent number from 2013 onward. You can see that the CI did improve starting in 2014. As a percentage of the mean, '15 and '16 gave us our best results, right at 25% for both of those years. A nice, tight confidence interval is something a biologist can really get excited about. It's one of the most direct measures of the quality of your data.  It's uncanny how three of the six years ended up with averages of 6.3 or 6.4. That certainly seems to be a magic number for Granby.
     So, is this data telling us there is a trend in lake trout densities in the lake? The simplest analysis we can run to answer that question is to check the linear regression. We'll get rid of the CI's, just take the singular points (average catch) from each year, put a regression line across them, and check the significance of the slope of that line. If you've forgotten from stats class, the regression line is the line that you can run across those six points that has the least total distance from the six points. There is only one possible line that meets that description.  Here's what that looks like:

     You can see that this line does have  a slight downward slope. To be exact, it's -0.14 lake trout per year. That is, our average catch across the 32 nets is decreasing by 0.14 fish per year.  But, is this trend real, or is it just an artifact of random chance, or error -- just the natural variability that is obviously going to occur in this type of sampling? Let's check that. If I run the analysis to calculate the 80% confidence interval of that slope, which is based on the amount of scatter that those points have around the line, it turns out that the CI includes zero. That is, if we took six data points out of this theoretical "population" of possible data points, there is an 80% chance that the slope of the trend line would be somewhere between the values of -0.41 and 0.13. Because that interval includes the number zero, we can conclude that this negative slope is not significant. If we ran that analysis with a 90% or 95% CI, that range is wider, and still encompasses zero. 
     Let's circle back to the original question - does this data tell us that the lake trout density in Granby is increasing or decreasing? By this analysis, there is a suggestion that there is a slight decrease taking place, but it is not statistically significant. There is definitely no evidence here that the density is increasing. The odds that the population is decreasing are better than the odds that it is increasing.  If we get 6.3 or higher in 2017, that negative slope will
disappear. Remember that I said that this data set is designed to detect long-term trends, and six years into this we're just barely getting started.
     Now let's take the same data and look at it a different way. We can look at each net individually, put a regression line on the six points of catch data from that net, and look at the slope of that line. I've got 24 locations where we have set nets for six consecutive years. The reason that I don't have 32 is that some of the fixed locations are out of the water during drought periods. When that happens, I add an alternative point to take the place of the one that is out of the water. If there is water there in a future year, though, I come back to it because it's important to get a representation of shallow habitat. 
     So looking at it this way, we can calculate the slope of 24 different regression lines - one line for each net location that I've fished all six years. Rather than make a very messy graph, it's best to look at that information in a table, like this:

Net #
2011
2012
2013
2014
2015
2016
Slope
1
8
10
4
1
6
6
-0.71
3
1
1
1
10
9
3
1.23
4
13
2
17
9
2
7
-1.09
5
16
14
0
8
10
9
-1.11
6
7
9
9
4
13
5
-0.09
7
5
8
1
4
4
4
-0.40
8
1
5
11
12
8
8
1.29
9
1
1
1
1
2
0
-0.06
11
9
5
7
7
1
2
-1.34
12
13
2
4
4
7
5
-0.71
13
19
9
24
6
5
4
-3.00
16
7
4
4
3
4
11
0.54
18
5
11
20
7
11
7
-0.09
21
2
6
6
3
3
4
-0.06
22
4
12
3
2
3
6
-0.51
24
8
4
5
3
2
9
-0.09
26
15
9
4
5
7
6
-1.43
27
7
6
12
10
11
6
0.23
28
4
3
10
6
9
6
0.69
29
2
0
4
1
8
7
1.31
30
4
5
8
3
4
2
-0.51
31
10
16
4
1
11
3
-1.51
33
11
3
2
3
6
3
-0.86
35
8
10
5
2
12
5
-0.34

     So now, in the column on the right, we've got the slope of those 24 lines. We can run some statistics on those 24 values. You can see that 18 nets have a negative slope, while 6 have a positive one. The average value of these slopes is -0.36. If we calculate the 80% confidence interval of those values, it covers the range from -0.63 to -0.09. Interesting -- notice that this interval does not cover zero and does not enter into positive territory. If we jump the confidence level up to 95%, that interval does cover zero, slightly: it tops out at 0.06. 
     Again, back to the original question: are lake trout densities in Granby increasing or decreasing? This second way of looking at the data also provides evidence -- a little stronger evidence than the first method -- that the density is decreasing slightly.
     As you know, managing the balance of predator vs. prey at Granby is a constant challenge. In a small system such as this, lake trout have proven to be very effective at overwhelming and even eliminating their prey base. In order for me to manage a water that produces trophy lake trout, the main thing that I have to accomplish is to do everything possible to ensure that there is an adequate prey base -- namely, kokanee -- to produce those trophy macs. In recent years we have experienced an almost complete collapse of kokanee at Granby, and the lake has not come anywhere close to producing enough eggs to sustain itself. In 2016 we came the closest we've ever come to simply not having the eggs to maintain the historic stocking rate at Granby, which is 1 million kokanee fry annually. We all know that there are multiple pressures on the kokanee population besides lake trout predation and all these pressures together have combined to nearly eliminate the species from the reservoir. 
     Given the situation at Granby, the topic of a regulation change regularly comes up. The last time the lake trout regulation was changed was the year before I took this job, in 2006. So we've had this regulation for ten years. In that time, the population of lake trout anglers at Granby has embraced the idea that harvest is a necessary element to maintain the health of the fishery. Even the most hard-core laker enthusiasts have no qualms about taking home a bag limit of "eaters," and Granby is an absolute factory when it comes to producing fish in the two-pound range, because of the high densities of mysis shrimp. I do not know whether or not the number of fish being harvested is having an impact on the population. Part of me suspects that it is not. However, I have discussed the evidence that I have that the lake trout population is not increasing.  This is the reason that I don't feel a strong need, or an urgency, for another bag limit increase at the moment. On one hand, you could say, "the increased bag limit instituted in 2006 did not go far enough to prevent a kokanee crash," which may be the case, but this has also been a period of very high mysis densities and low zooplankton production, which is the most important kokanee food source. All of the conditions in Granby over the past decade have been generally unfavorable for kokanee.
     If the evidence that I discussed above were pointing the opposite direction -- if we had multiple analytical methods all telling us that the lake trout density was increasing -- I would have a completely different opinion of the need for another increase in the bag limit. That information, in combination with the kokanee collapse, would suggest to me an urgent need to increase harvest. But at the moment, the evidence I've got suggests that the anglers are doing their part. Would I like to see lake trout densities decreasing more quickly? Given the kokanee situation, yes, I absolutely would, until we see a kokanee recovery. Would going from a 4-fish bag to an 8-fish bag accomplish that? I'm not so sure of that. The best estimate we can come up with is that there are probably between 150,000 and 400,000 lake trout in Granby over 12 inches. If the current level of harvest is creating a slow-but-steady thinning of that number, that's great. But another part of me thinks that this subtle decline is just as much a response to some environmental condition in the lake. I think that sometimes it's easy to overestimate the impact of angler harvest in a situation like this.
     There are many other nuggets of information in the data that I just collected, but this post is already dragging on and I've barely scratched the surface. So that will have to wait. But I'll answer the question that may have been in your mind from the start: what was the biggest fish this year? 43 inches, 27 pounds. Here's a picture of my technician Chris with the fish.

     Just today, we picked one up at Williams Fork that beats this by nine pounds, but that's another story . . .