We spent four days recently running our annual gillnet survey at Granby. We had good luck with the weather, for the most part dodging the standard Granby afternoon wind-rodeos. May 19, 23, 24, & 25 were the days that we were out there. We set 32 gillnets in randomly selected locations for six hours each. Although the 32 locations are randomly selected, we use the same points (or as many of them as possible) every year to give us valid comparisons over time. This was the sixth year that we have run this survey.
The average lake elevation across those four days was 8,262, or 18 feet below full pool. This was 12 feet lower than when we ran this survey last year. The average lake elevation for the previous five years when we have run the survey is 8,256, or 24 feet below full.
Average water temperature was 45.4. The temperature during the survey over the previous five years has averaged 48.2, so the lake is a little on the cool side so far this spring.
If you haven't figured it out yet, this is going to be a stats-heavy discussion. One of the reasons that I am proud of this data set is that you can look at it from many different analytical angles, many of which are somewhat independent of each other. I will offer the caveat up front though, that my statistical understanding and abilities lie more or less at the undergraduate level. Statistical analysis is one of the things that I enjoy most about my job, but my skills lie firmly in the classical, parametric, nuts-and-bolts utilitarian realm rather than the advanced and highly complex world of Bayesian or other approaches found in the scientific literature these days. So I am by no means a Statistical Titan. The reason I'm pointing this out is that if any stat-heads out there see fatal flaws or additional approaches that I'm not making use of -- by all means, please point that out to me and let's have the discussion. If you're a license buyer, I collect this information on your behalf, and let's get the most that we possibly can out of it.
So -- the purpose of this survey, and this approach, is to be able to detect trends in the lake trout population. Is the population increasing, decreasing, or remaining static? Also, is the size structure of the population changing? Thirdly, what does the condition of the fish that we capture tell me about the condition of the prey base?
Because lake trout populations experience change slowly -- much more slowly than riverine trout populations -- changes from one year to the next are less instructive than long-term trends that only become apparent over years or even decades. This type of long-term change is exactly what this data set is designed to detect. I regularly hear anecdotal reports that the density of lake trout in Granby seemed to be much higher in the '80's -- which I don't doubt, but I have no data, no standardized survey, that was conducted in the '80's that I can repeat precisely. That is frustrating. Going into future decades, none of my successors will experience that frustration.
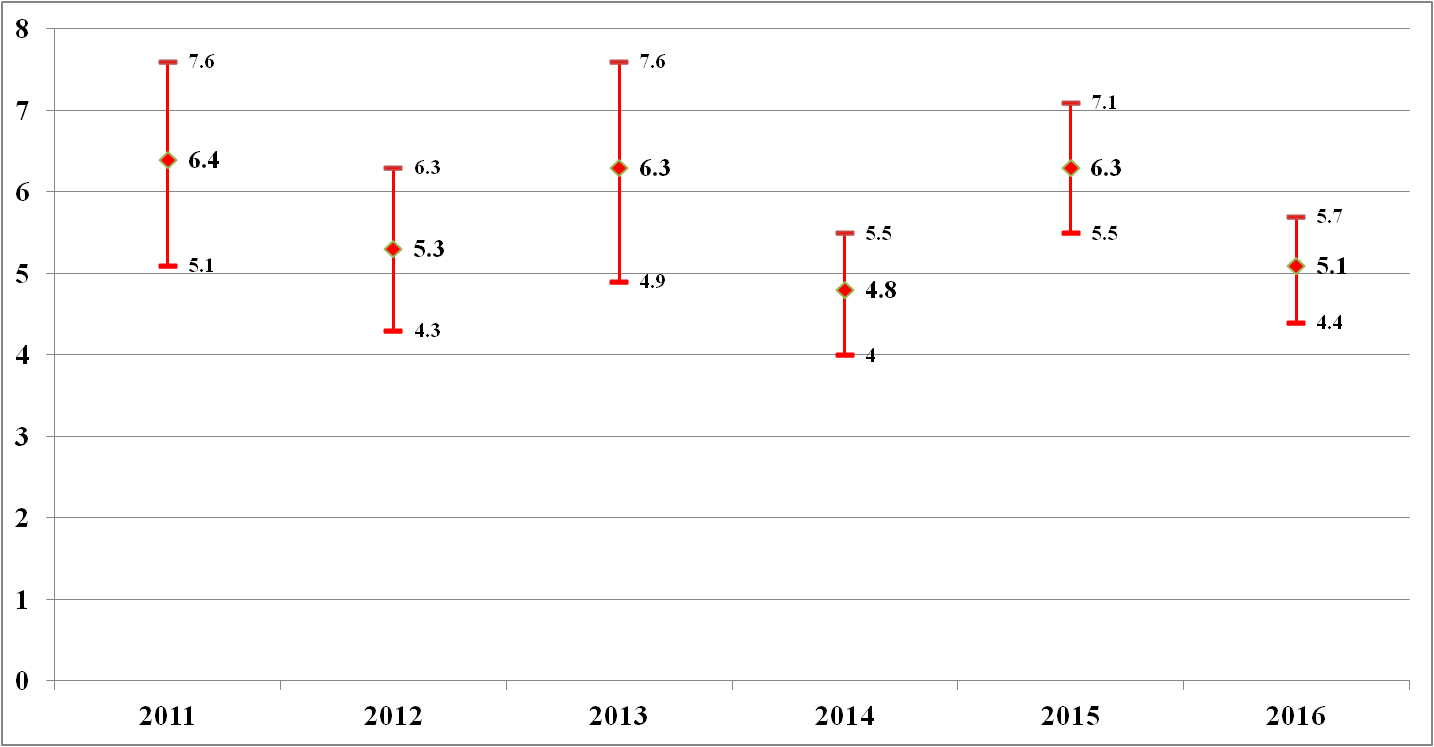
Now for some results. I haven't analyzed things to the fullest extent possible yet. The time for that is during the winter. However I do run some of the main analyses right away because I'm anxious to see what things are looking like. The first one is in the graph below, which displays average number of lake trout caught per net across the 32 net sets. The 80% confidence interval is included in the graph. If you're not familiar with confidence intervals, this is the calculation that determines that if you were to run 1,000 net sets instead of 32, 800 of them would fall within that interval.

In 2011 and 2012, we ran 30 nets. In order to tighten up that confidence interval, I added two nets and settled on 32 as the permanent number from 2013 onward. You can see that the CI did improve starting in 2014. As a percentage of the mean, '15 and '16 gave us our best results, right at 25% for both of those years. A nice, tight confidence interval is something a biologist can really get excited about. It's one of the most direct measures of the quality of your data. It's uncanny how three of the six years ended up with averages of 6.3 or 6.4. That certainly seems to be a magic number for Granby.
So, is this data telling us there is a trend in lake trout densities in the lake? The simplest analysis we can run to answer that question is to check the linear regression. We'll get rid of the CI's, just take the singular points (average catch) from each year, put a regression line across them, and check the significance of the slope of that line. If you've forgotten from stats class, the regression line is the line that you can run across those six points that has the least total distance from the six points. There is only one possible line that meets that description. Here's what that looks like:

You can see that this line does have a slight downward slope. To be exact, it's -0.14 lake trout per year. That is, our average catch across the 32 nets is decreasing by 0.14 fish per year. But, is this trend real, or is it just an artifact of random chance, or error -- just the natural variability that is obviously going to occur in this type of sampling? Let's check that. If I run the analysis to calculate the 80% confidence interval of that slope, which is based on the amount of scatter that those points have around the line, it turns out that the CI includes zero. That is, if we took six data points out of this theoretical "population" of possible data points, there is an 80% chance that the slope of the trend line would be somewhere between the values of -0.41 and 0.13. Because that interval includes the number zero, we can conclude that this negative slope is not significant. If we ran that analysis with a 90% or 95% CI, that range is wider, and still encompasses zero.
Let's circle back to the original question - does this data tell us that the lake trout density in Granby is increasing or decreasing? By this analysis, there is a suggestion that there is a slight decrease taking place, but it is not statistically significant. There is definitely no evidence here that the density is increasing. The odds that the population is decreasing are better than the odds that it is increasing. If we get 6.3 or higher in 2017, that negative slope will
disappear. Remember that I said that this data set is designed to detect long-term trends, and six years into this we're just barely getting started.
Now let's take the same data and look at it a different way. We can look at each net individually, put a regression line on the six points of catch data from that net, and look at the slope of that line. I've got 24 locations where we have set nets for six consecutive years. The reason that I don't have 32 is that some of the fixed locations are out of the water during drought periods. When that happens, I add an alternative point to take the place of the one that is out of the water. If there is water there in a future year, though, I come back to it because it's important to get a representation of shallow habitat.
So looking at it this way, we can calculate the slope of 24 different regression lines - one line for each net location that I've fished all six years. Rather than make a very messy graph, it's best to look at that information in a table, like this:
So now, in the column on the right, we've got the slope of those 24 lines. We can run some statistics on those 24 values. You can see that 18 nets have a negative slope, while 6 have a positive one. The average value of these slopes is -0.36. If we calculate the 80% confidence interval of those values, it covers the range from -0.63 to -0.09. Interesting -- notice that this interval does not cover zero and does not enter into positive territory. If we jump the confidence level up to 95%, that interval does cover zero, slightly: it tops out at 0.06.
Again, back to the original question: are lake trout densities in Granby increasing or decreasing? This second way of looking at the data also provides evidence -- a little stronger evidence than the first method -- that the density is decreasing slightly.
As you know, managing the balance of predator vs. prey at Granby is a constant challenge. In a small system such as this, lake trout have proven to be very effective at overwhelming and even eliminating their prey base. In order for me to manage a water that produces trophy lake trout, the main thing that I have to accomplish is to do everything possible to ensure that there is an adequate prey base -- namely, kokanee -- to produce those trophy macs. In recent years we have experienced an almost complete collapse of kokanee at Granby, and the lake has not come anywhere close to producing enough eggs to sustain itself. In 2016 we came the closest we've ever come to simply not having the eggs to maintain the historic stocking rate at Granby, which is 1 million kokanee fry annually. We all know that there are multiple pressures on the kokanee population besides lake trout predation and all these pressures together have combined to nearly eliminate the species from the reservoir.
Given the situation at Granby, the topic of a regulation change regularly comes up. The last time the lake trout regulation was changed was the year before I took this job, in 2006. So we've had this regulation for ten years. In that time, the population of lake trout anglers at Granby has embraced the idea that harvest is a necessary element to maintain the health of the fishery. Even the most hard-core laker enthusiasts have no qualms about taking home a bag limit of "eaters," and Granby is an absolute factory when it comes to producing fish in the two-pound range, because of the high densities of mysis shrimp. I do not know whether or not the number of fish being harvested is having an impact on the population. Part of me suspects that it is not. However, I have discussed the evidence that I have that the lake trout population is not increasing. This is the reason that I don't feel a strong need, or an urgency, for another bag limit increase at the moment. On one hand, you could say, "the increased bag limit instituted in 2006 did not go far enough to prevent a kokanee crash," which may be the case, but this has also been a period of very high mysis densities and low zooplankton production, which is the most important kokanee food source. All of the conditions in Granby over the past decade have been generally unfavorable for kokanee.
If the evidence that I discussed above were pointing the opposite direction -- if we had multiple analytical methods all telling us that the lake trout density was increasing -- I would have a completely different opinion of the need for another increase in the bag limit. That information, in combination with the kokanee collapse, would suggest to me an urgent need to increase harvest. But at the moment, the evidence I've got suggests that the anglers are doing their part. Would I like to see lake trout densities decreasing more quickly? Given the kokanee situation, yes, I absolutely would, until we see a kokanee recovery. Would going from a 4-fish bag to an 8-fish bag accomplish that? I'm not so sure of that. The best estimate we can come up with is that there are probably between 150,000 and 400,000 lake trout in Granby over 12 inches. If the current level of harvest is creating a slow-but-steady thinning of that number, that's great. But another part of me thinks that this subtle decline is just as much a response to some environmental condition in the lake. I think that sometimes it's easy to overestimate the impact of angler harvest in a situation like this.
There are many other nuggets of information in the data that I just collected, but this post is already dragging on and I've barely scratched the surface. So that will have to wait. But I'll answer the question that may have been in your mind from the start: what was the biggest fish this year? 43 inches, 27 pounds. Here's a picture of my technician Chris with the fish.

The average lake elevation across those four days was 8,262, or 18 feet below full pool. This was 12 feet lower than when we ran this survey last year. The average lake elevation for the previous five years when we have run the survey is 8,256, or 24 feet below full.
Average water temperature was 45.4. The temperature during the survey over the previous five years has averaged 48.2, so the lake is a little on the cool side so far this spring.
If you haven't figured it out yet, this is going to be a stats-heavy discussion. One of the reasons that I am proud of this data set is that you can look at it from many different analytical angles, many of which are somewhat independent of each other. I will offer the caveat up front though, that my statistical understanding and abilities lie more or less at the undergraduate level. Statistical analysis is one of the things that I enjoy most about my job, but my skills lie firmly in the classical, parametric, nuts-and-bolts utilitarian realm rather than the advanced and highly complex world of Bayesian or other approaches found in the scientific literature these days. So I am by no means a Statistical Titan. The reason I'm pointing this out is that if any stat-heads out there see fatal flaws or additional approaches that I'm not making use of -- by all means, please point that out to me and let's have the discussion. If you're a license buyer, I collect this information on your behalf, and let's get the most that we possibly can out of it.
So -- the purpose of this survey, and this approach, is to be able to detect trends in the lake trout population. Is the population increasing, decreasing, or remaining static? Also, is the size structure of the population changing? Thirdly, what does the condition of the fish that we capture tell me about the condition of the prey base?
Because lake trout populations experience change slowly -- much more slowly than riverine trout populations -- changes from one year to the next are less instructive than long-term trends that only become apparent over years or even decades. This type of long-term change is exactly what this data set is designed to detect. I regularly hear anecdotal reports that the density of lake trout in Granby seemed to be much higher in the '80's -- which I don't doubt, but I have no data, no standardized survey, that was conducted in the '80's that I can repeat precisely. That is frustrating. Going into future decades, none of my successors will experience that frustration.
Now for some results. I haven't analyzed things to the fullest extent possible yet. The time for that is during the winter. However I do run some of the main analyses right away because I'm anxious to see what things are looking like. The first one is in the graph below, which displays average number of lake trout caught per net across the 32 net sets. The 80% confidence interval is included in the graph. If you're not familiar with confidence intervals, this is the calculation that determines that if you were to run 1,000 net sets instead of 32, 800 of them would fall within that interval.
In 2011 and 2012, we ran 30 nets. In order to tighten up that confidence interval, I added two nets and settled on 32 as the permanent number from 2013 onward. You can see that the CI did improve starting in 2014. As a percentage of the mean, '15 and '16 gave us our best results, right at 25% for both of those years. A nice, tight confidence interval is something a biologist can really get excited about. It's one of the most direct measures of the quality of your data. It's uncanny how three of the six years ended up with averages of 6.3 or 6.4. That certainly seems to be a magic number for Granby.
So, is this data telling us there is a trend in lake trout densities in the lake? The simplest analysis we can run to answer that question is to check the linear regression. We'll get rid of the CI's, just take the singular points (average catch) from each year, put a regression line across them, and check the significance of the slope of that line. If you've forgotten from stats class, the regression line is the line that you can run across those six points that has the least total distance from the six points. There is only one possible line that meets that description. Here's what that looks like:

You can see that this line does have a slight downward slope. To be exact, it's -0.14 lake trout per year. That is, our average catch across the 32 nets is decreasing by 0.14 fish per year. But, is this trend real, or is it just an artifact of random chance, or error -- just the natural variability that is obviously going to occur in this type of sampling? Let's check that. If I run the analysis to calculate the 80% confidence interval of that slope, which is based on the amount of scatter that those points have around the line, it turns out that the CI includes zero. That is, if we took six data points out of this theoretical "population" of possible data points, there is an 80% chance that the slope of the trend line would be somewhere between the values of -0.41 and 0.13. Because that interval includes the number zero, we can conclude that this negative slope is not significant. If we ran that analysis with a 90% or 95% CI, that range is wider, and still encompasses zero.
Let's circle back to the original question - does this data tell us that the lake trout density in Granby is increasing or decreasing? By this analysis, there is a suggestion that there is a slight decrease taking place, but it is not statistically significant. There is definitely no evidence here that the density is increasing. The odds that the population is decreasing are better than the odds that it is increasing. If we get 6.3 or higher in 2017, that negative slope will
disappear. Remember that I said that this data set is designed to detect long-term trends, and six years into this we're just barely getting started.
Now let's take the same data and look at it a different way. We can look at each net individually, put a regression line on the six points of catch data from that net, and look at the slope of that line. I've got 24 locations where we have set nets for six consecutive years. The reason that I don't have 32 is that some of the fixed locations are out of the water during drought periods. When that happens, I add an alternative point to take the place of the one that is out of the water. If there is water there in a future year, though, I come back to it because it's important to get a representation of shallow habitat.
So looking at it this way, we can calculate the slope of 24 different regression lines - one line for each net location that I've fished all six years. Rather than make a very messy graph, it's best to look at that information in a table, like this:
Net
#
|
2011
|
2012
|
2013
|
2014
|
2015
|
2016
|
Slope
|
1
|
8
|
10
|
4
|
1
|
6
|
6
|
-0.71
|
3
|
1
|
1
|
1
|
10
|
9
|
3
|
1.23
|
4
|
13
|
2
|
17
|
9
|
2
|
7
|
-1.09
|
5
|
16
|
14
|
0
|
8
|
10
|
9
|
-1.11
|
6
|
7
|
9
|
9
|
4
|
13
|
5
|
-0.09
|
7
|
5
|
8
|
1
|
4
|
4
|
4
|
-0.40
|
8
|
1
|
5
|
11
|
12
|
8
|
8
|
1.29
|
9
|
1
|
1
|
1
|
1
|
2
|
0
|
-0.06
|
11
|
9
|
5
|
7
|
7
|
1
|
2
|
-1.34
|
12
|
13
|
2
|
4
|
4
|
7
|
5
|
-0.71
|
13
|
19
|
9
|
24
|
6
|
5
|
4
|
-3.00
|
16
|
7
|
4
|
4
|
3
|
4
|
11
|
0.54
|
18
|
5
|
11
|
20
|
7
|
11
|
7
|
-0.09
|
21
|
2
|
6
|
6
|
3
|
3
|
4
|
-0.06
|
22
|
4
|
12
|
3
|
2
|
3
|
6
|
-0.51
|
24
|
8
|
4
|
5
|
3
|
2
|
9
|
-0.09
|
26
|
15
|
9
|
4
|
5
|
7
|
6
|
-1.43
|
27
|
7
|
6
|
12
|
10
|
11
|
6
|
0.23
|
28
|
4
|
3
|
10
|
6
|
9
|
6
|
0.69
|
29
|
2
|
0
|
4
|
1
|
8
|
7
|
1.31
|
30
|
4
|
5
|
8
|
3
|
4
|
2
|
-0.51
|
31
|
10
|
16
|
4
|
1
|
11
|
3
|
-1.51
|
33
|
11
|
3
|
2
|
3
|
6
|
3
|
-0.86
|
35
|
8
|
10
|
5
|
2
|
12
|
5
|
-0.34
|
So now, in the column on the right, we've got the slope of those 24 lines. We can run some statistics on those 24 values. You can see that 18 nets have a negative slope, while 6 have a positive one. The average value of these slopes is -0.36. If we calculate the 80% confidence interval of those values, it covers the range from -0.63 to -0.09. Interesting -- notice that this interval does not cover zero and does not enter into positive territory. If we jump the confidence level up to 95%, that interval does cover zero, slightly: it tops out at 0.06.
Again, back to the original question: are lake trout densities in Granby increasing or decreasing? This second way of looking at the data also provides evidence -- a little stronger evidence than the first method -- that the density is decreasing slightly.
As you know, managing the balance of predator vs. prey at Granby is a constant challenge. In a small system such as this, lake trout have proven to be very effective at overwhelming and even eliminating their prey base. In order for me to manage a water that produces trophy lake trout, the main thing that I have to accomplish is to do everything possible to ensure that there is an adequate prey base -- namely, kokanee -- to produce those trophy macs. In recent years we have experienced an almost complete collapse of kokanee at Granby, and the lake has not come anywhere close to producing enough eggs to sustain itself. In 2016 we came the closest we've ever come to simply not having the eggs to maintain the historic stocking rate at Granby, which is 1 million kokanee fry annually. We all know that there are multiple pressures on the kokanee population besides lake trout predation and all these pressures together have combined to nearly eliminate the species from the reservoir.
Given the situation at Granby, the topic of a regulation change regularly comes up. The last time the lake trout regulation was changed was the year before I took this job, in 2006. So we've had this regulation for ten years. In that time, the population of lake trout anglers at Granby has embraced the idea that harvest is a necessary element to maintain the health of the fishery. Even the most hard-core laker enthusiasts have no qualms about taking home a bag limit of "eaters," and Granby is an absolute factory when it comes to producing fish in the two-pound range, because of the high densities of mysis shrimp. I do not know whether or not the number of fish being harvested is having an impact on the population. Part of me suspects that it is not. However, I have discussed the evidence that I have that the lake trout population is not increasing. This is the reason that I don't feel a strong need, or an urgency, for another bag limit increase at the moment. On one hand, you could say, "the increased bag limit instituted in 2006 did not go far enough to prevent a kokanee crash," which may be the case, but this has also been a period of very high mysis densities and low zooplankton production, which is the most important kokanee food source. All of the conditions in Granby over the past decade have been generally unfavorable for kokanee.
If the evidence that I discussed above were pointing the opposite direction -- if we had multiple analytical methods all telling us that the lake trout density was increasing -- I would have a completely different opinion of the need for another increase in the bag limit. That information, in combination with the kokanee collapse, would suggest to me an urgent need to increase harvest. But at the moment, the evidence I've got suggests that the anglers are doing their part. Would I like to see lake trout densities decreasing more quickly? Given the kokanee situation, yes, I absolutely would, until we see a kokanee recovery. Would going from a 4-fish bag to an 8-fish bag accomplish that? I'm not so sure of that. The best estimate we can come up with is that there are probably between 150,000 and 400,000 lake trout in Granby over 12 inches. If the current level of harvest is creating a slow-but-steady thinning of that number, that's great. But another part of me thinks that this subtle decline is just as much a response to some environmental condition in the lake. I think that sometimes it's easy to overestimate the impact of angler harvest in a situation like this.
There are many other nuggets of information in the data that I just collected, but this post is already dragging on and I've barely scratched the surface. So that will have to wait. But I'll answer the question that may have been in your mind from the start: what was the biggest fish this year? 43 inches, 27 pounds. Here's a picture of my technician Chris with the fish.

Just today, we picked one up at Williams Fork that beats this by nine pounds, but that's another story . . .