Monday, March 3, 2014

State of the Fish

     I have scheduled my annual "State of the Fish" meetings for this month. On Tuesday the 18th we'll be at the Frisco library, in the Buffalo Mountain Room, at 6:30. On Wednesday the 19th we'll be at the Granby public library, also at 6:30. These meetings will follow an open format, and we'll talk about whatever waters folks are interested in talking about. There are a few regulation items I'd like to discuss, if anyone in attendance is interested:

  • Grand Lake lake trout
  • Granby lake trout
  • Dillon char
     I hope to see lots of folks come out for these. I'll stick around for as long as anyone wants to hang out and discuss things.

     Aside from that I'm having trouble coming up with topics for posting right now. I need some ideas from you folks. 

     February was a ridiculously warm month, and these reservoirs are not going to make it to April 1 with the ice on if this weather keeps up. Things are changing fast. It's looking like the earliest ice-out I've seen since I've been around here. I wish that wasn't the case because I'm not going to be ready for it before April 1.

     I'm headed up to Laramie for our annual American Fisheries Society meeting/conference, which is always a great experience, with lots of information being exchanged and new ideas being born.


Friday, February 14, 2014

Scrappy Sculpin and the Sad, Sad Snake

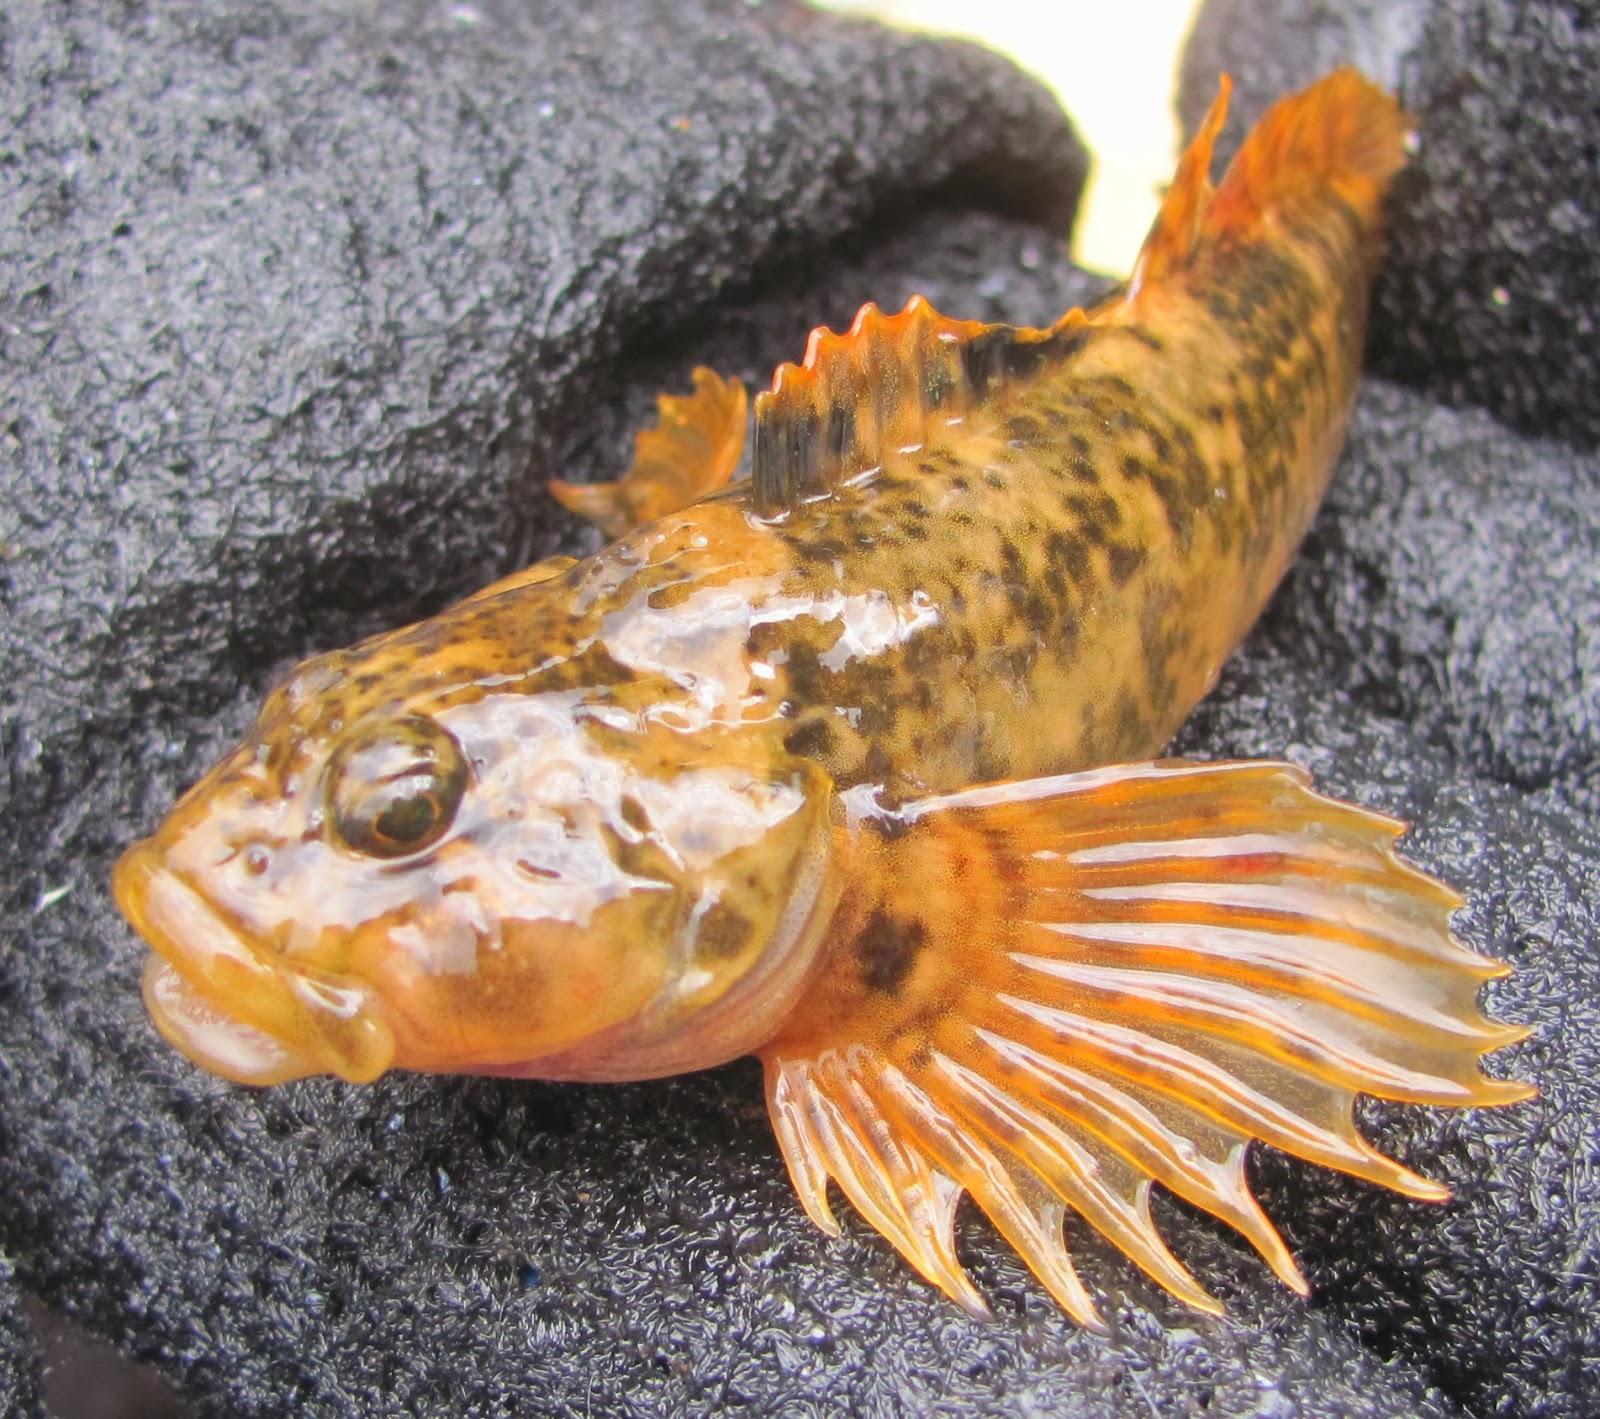
     Thought I'd share some info on a couple different topics. First, one of my favorite fish species of all time - mottled sculpin, Cottus bairdi. I previously posted some pics of a recently-consumed sculpin coming out of the throat of a brown, down at State Bridge. We are lucky to have some areas of very dense sculpin populations, where they are the most numerous species of fish. Here's my favorite picture of a sculpin, taken by my Forest Service counterpart Corey Lewellen:


     They've got the best pectoral fins out there.
     One reason it occurred to me to discuss our sculpin populations is the appearance of this recent news item:

http://news.yahoo.com/big-headed-fish-species-discovered-idaho-montana-rivers-201333579.html

     It is always interesting when a new species is described, and the news media picks up on it to say that it has been "discovered." It makes it sound as if no human has ever seen the fish before. The reality is, anglers and biologists have likely handled these fish untold thousands of times; it's just that this is the first time that they were examined genetically. I'm certain that something very similar would happen if we closely examined our sculpin species in Colorado. We would probably have at least one new named subspecies or species. Right now, we've got two that we know about; paiute sculpin (Cottus beldingi) and mottled sculpin (Cottus bairdi). Some of the sculpin from waters in Grand County have been keyed out as paiutes, which is only possible in a lab. The bottom line is, we don't know the exact distribution of the two species, if they overlap, if there is hybridization, or if there is at least another subspecies that is unrecognized. There has been talk that the sculpin in the Eagle River may constitute their own subspecies. For simplicity's sake, what is important is that they're a native fish, and on the upper Colorado we've always referred to all of them as mottled sculpin.
     We've found some interesting patterns in their distribution at the headwaters of the Colorado River. Below is a map depicting a simplified version of the distribution pattern:

     The green lines I've drawn here represent streams that have sculpin populations, and the red lines represent streams where sculpin are absent.  We have found that almost without exception, we have dense populations of sculpin upstream of every impoundment in Grand County, and the absence of sculpin below every impoundment. It is astounding how consistent this pattern is. Last September I was able to add the Muddy Creek watershed to this map, after doing some sampling on private land upstream of Wolford Reservoir and finding high numbers of sculpin there. There are zero sculpin in Muddy Creek below Wolford. Williams Fork, Windy Gap, Willow Creek, and Granby - all these reservoirs have dense sculpin populations upstream and no sculpin downstream.
     On the Fraser River in the town of Granby, sculpin are by far the most numerous fish species. In 2012, in a 600-foot reach of river there, we collected 1,279 sculpin, and they constituted 83% of the fish we captured. That yielded a population estimate of at least 20,000 fish per mile. Moving downstream past Windy Gap, to the mainstem of the Colorado River, at the Hitchin' Post Bridge, we have searched the riffles there every year for sculpin and found zero. This is only about four miles from the site on the Fraser in Granby, and the species that is most plentiful in the first site is completely absent from the second site. 
     Sculpin reappear in the Colorado River at some point below the Blue River confluence. At Pumphouse, they are very dense again, and are again the most numerous fish species present. 
     We don't know the precise reasons for this distribution pattern, but we would like to. It's not an overstatement to say that there has to be a massive ecological shift that takes place over short geographical distances to produce such a contrast. 
     On a positive note, there is some movement toward mitigation work taking place on the Colorado as part of ongoing negotiations with the water providers. It's looking likely that Windy Gap will be re-engineered somehow to become an off-channel reservoir, and that a bypass will be built. Also it looks like there may be a pool of money that becomes available to to a lot of physical habitat work in the river from Windy Gap on down. We'll see.

     I gave an update recently at a meeting of the Snake River Watershed Task Force in Keystone. If you're not familiar with the Snake River, it's an interesting place. It's got by far the most polluted water of any stream in the area. A lot of the metals pollution comes from the Peru Creek drainage, where there are old mines releasing acidic water laden with high concentrations of metals that are lethal to fish. If you're at all interested in water chemistry, Peru Creek is a fascinating place. You can walk up the stream and the bed of it is an ever-changing rainbow of colors, based on which metal is precipitating out of the water in that particular reach. There are white sections, red sections, greens, blues - lots of different shades.
     Below is a map, courtesy of my USGS colleague Andrew Todd, depicting where in the Snake River watershed we have fish living in streams and where we have no fish at all. The blue sections are where there are fish, and red is where there are none:

     Below Peru Creek, the only reason that any fish can live in the Snake River at all is the dilution that is provided by the North Fork, coming down off of Loveland Pass. The amount of relatively clean water coming from that drainage dilutes the metals pollution just enough to allow some trout to persist below that point. However, it's not exactly a high-quality trout population.
     We have a survey site, right along the base of Keystone, that we sample every year to check on the status of the fish population and it tells some interesting stories. The brook trout numbers tell us the most, because those fish  are never stocked or manipulated in any way -- if they're there, they got there on their own. Here is the population estimate for brook trout on that reach going back to 2007:


     These numbers are estimates of the total number of brook trout inhabiting the 500+ foot reach that we survey. It's not extrapolated out to fish per mile or anything. So you can see, this is a distressed fish population and this river teeters on the edge of even being suitable for fish at all. The reason why there are two samples in 2007 is that there was a flash flood from a cloudburst that hit the Peru Creek basin in late July of that year. We had already surveyed the site before the flood. We had reports from the public that there had been a fish kill during the flood. We went back a month after the flood and electrofished again, and saw that the flood had wiped out the brook trout population, and in fact it wasn't until three years later, in 2010, that we even saw brook trout there again. And, as you can see, the brook trout population has never returned to pre-2007 flood levels. 
     Keystone Resort purchases and stocks rainbow trout annually in this reach of river. They buy them at a large size, and they do provide entertaining fishing for the tourists. I wondered if we get any holdovers at all from year to year among those rainbows, and so in 2008 I started adipose-clipping all the rainbows that we handled in the survey section. This way, we can see whether or not any of those stocked rainbows survive a winter there. Below are those results:
r
     So, out of the 46 fish that we marked in 2008, we captured 5 in 2009, for 11% survival, and so on. 2012 and 2013 have been particularly rough in this respect. For this data, fish emigrating out of the reach counts the same as mortality. Whichever happens, it's obviously not very hospitable there.
     The good news about the Snake River is that after a couple of decades of effort and attention, there is a broad coalition of entities (EPA, US Forest Service, USGS, Summit County, etc.,) starting to clean up the mines of Peru Creek.  It has taken a huge amount of concentrated effort and searching for funding. There is real momentum now and in 2013 quite a bit of underground work was done to figure out what it's going to take to clean up some of the most polluted water. So, hopefully in future years we'll see those metals concentrations drop and a healthier fishery develop.


Thursday, January 30, 2014

Tough times in Parshall

     I've done some processing of the data that I collected on the Parshall reach of river and it's not great news. This is the reach of river that we have a long-running historic data set for, going back to 1981. I survey two miles of river there every September, starting in the split channels upstream from the Parshall Hole, and continuing on downstream into the BLM Sunset parcel. We end it at the big irrigation diversion there. This reach of river has really been struggling the past several years and I can't put my finger on the exact reason why. Here are the population estimates in fish per mile greater than 6" (rainbows and browns combined) going back to 2000:

     Here are the rainbow population estimates:


     2012 was the year that we finally saw good success with the HXC's. Rainbow numbers came down in 2013 but I'm optimistic that the overall trend will be upward in the coming years. A quick comparison of the two figures shows that rainbows still make up only approximately 4% of the total trout population of fish greater than 6". Anglers have been reporting better catches of rainbows since 2012, but you have to remember that rainbows are approximately 10 times more vulnerable to being caught than browns are. So you can have a population that is 90% browns and 10% rainbows, and because of the greater catchability of rainbows, an angler may perceive that there are equal numbers of the two based on his catch rates. 
     Here are the density estimates of "quality" browns (over 14"), by surface acre of river. To me, this is the most disturbing statistic:

     As you can see, this is the lowest estimate we've had in recent history for fish >14". This reach of river has really been struggling in this regard. At this point it's barely maintaining the minimum standard for a gold medal-designated fishery. In 2010, we captured more than twice as many browns over 14" on that reach of river than we did in 2013. The gold medal standard is at least 12 fish per acre over 14", and at least 60 lbs./acre of total trout biomass. Speaking of biomass, here are the estimates from recent years:

     This is the only parameter that we saw an increase in 2013 - albeit a small one at that, and well within the margin of error for these estimates.
     So when I've got data like this that shows a lot of doom and gloom, one of the first things I do is ask myself if there is some way that the data could be wrong, and that it is not reflecting true trends in the population. The biggest reason for it to be totally wrong would be if during some years there is some large-scale movement of fish out of the reach, and in some years the opposite. But we know that for the most part browns don't move large distances. Most movement studies that have been done with trout in rivers show that a very small percentage of fish move large distances, but most fish live their whole lives over a relatively small reach of river - a mile or a few. The way that I control for timing of movements is by running this survey as close to the same dates as possible every year - right around the third week of September. The reason why it works best at this time is that the water has cooled enough that it's not overly stressful on the fish, and it's still early enough that major spawning movements and concentrations are not in full swing yet. 
   The other thing that makes me think these trends are real is best illustrated in the biomass estimates. The trend was downward every year from 2007 to 2012. If there was a large amount of error in this estimate, there would be a lot more variation - it would bounce around more. 
     I'm interested in hearing from folks who fish the Kemp-Breeze a lot, to know if their angling experiences match what I'm seeing in this data. Are you catching fewer browns over 14" than you did just a few years ago? Has the average size of fish that you are catching become smaller? 
     So let's assume this is all real, and speculate as to the reasons. We know there is functionally no harvest taking place there, because it's a catch-and-release area. There is a ton of fishing pressure, but there always has been. I definitely don't believe that there was more pressure there in 2013 than there was three, or five, or ten years ago. This reach of river doesn't have extreme temperature problems because it's right below the Williams Fork confluence, which cools it down during the hottest portion of the summer.
     One thing that always lurks in the back of my mind is the impact of anchor ice in certain winters. Last winter was a great example, when we had weeks of brutal cold, around 30 below every night. During times like that, you can go look at the riffles right around the Parshall Hole and see the anchor ice covering the cobble. That has to have some form of impact. It's difficult to get an idea of how flow varies from year to year in the dead of winter, because the flow gauges in the area are off for the season. 
     I also wonder if it's a forage issue. We know that since the early '80's, we've lost the giant stonefly hatch that used to be prolific there. That species isn't the only one that's gone - our studies have found a whole list of invertebrate species that have disappeared from this reach of river. But these extirpations happened gradually over the past 30 years - it's reasonably safe to say that they had already occurred at the times in the previous decade when biomass was twice what it is now and when densities of quality trout were far higher. Also, there is evidence that does not support the forage limitation theory: the fact that body condition of the fish is consistently good. Not spectacular, like we have seen at Radium, but good. 
     It could be a habitat degradation issue. There are sections of river that are utterly featureless, and at 150 CFS on these sections the river is 200 feet wide, ankle deep, and contains nearly zero fish. Whether or not the physical habitat has slowly been degrading over time is a question that I don't have an answer for. 
     Anyway, I'm interested in hearing your thoughts on this, so let me know if you've got any opinions. Thanks.

Thursday, January 16, 2014

Good times at Radium & State Bridge

     Happy data season to all. I've been warmly ensconced in my office figuring out what I learned last field season. 
     My Glenwood counterpart, Kendall Bakich, and I did a bunch of survey work on four stations on the Colorado downstream of Gore Canyon last spring. I showed some pictures from those stations previously, but I've got that data processed now and thought I'd share some cool stuff. The Radium reach is exactly two miles of river, and the downstream end is the Radium bridge itself. The beginning of the station is up near that old cabin with the historical sign. Here is the table with some population estimates from the past four years on that section:


     As far as the rainbow numbers go, I don't get too worked up about the variation there. I think that in 2011 the timing of the spawning aggregations may have been different, causing us to pick up more fish. I don't know why numbers were down this year, but it was probably by chance too. I would describe the rainbow population in this reach of river as "incidental," sustained by whatever finds its way down there that was stocked upstream, either in reservoirs or on private water. Also, there is some low level of successful reproduction that does seem to take place, but never enough to really get the numbers going. At some point in the future I will probably start stocking HXC fry on this reach, but it will take a lot of them, and I'm doing that up above now which takes up about all of the HXC's I can get. Once they're well-established around Parshall, I'll probably switch the stocking effort downstream.
     The big news here is in the brown trout population trend. And the news is certainly good. We've seen steady and significant increases in just about every parameter of the brown trout population. I don't know exactly why it is, but I've got a theory or two.
     In 2012, you can see that the fish took a big jump up in body condition. Remember that these are spring surveys, so the body condition reflects how the fish came through that previous winter, as well as the summer before. 2011 was the giant flow year, in which the river hit 10,000 CFS at the Kremmling gauge. Often, when you look at body condition of trout after a big flow period, they lose weight during that time. But the opposite happened here. However, it's also true that the winter of 2011/2012 was not particularly cold, and it may be the case that conditions were mild enough that the fish were able to put on weight over the winter. At any rate, when you see average body condition so high, you can expect fast growth, good survival, and good fecundity (high numbers of eggs per female). 
     Our researcher Dan Kowalski has set up a monitoring program to track trends in abundance of the giant stonefly, pteronarcys californica, that we know is so critically important on that reach of river. Every year right after the hatch, he gathers a crew and we go down and count exoskeletons along an established reach of riverbank. Our site is 100 feet long. Below are the counts for that site:

     Again, this is the number of exoskeletons that we counted right after the hatch, on 100 feet of river bank. If you extrapolate this out to 1 mile on both banks of river, it yields an estimate for 2013 of about 1.8 million adult stoneflies per mile hatching in 2013. These stoneflies live for 3-4 years as nymphs before hatching as adults, so if you assume that there are 2-3 year classes in the river that did not hatch in 2013, we're talking about a population somewhere in the neighborhood of 6 million nymphs per mile. This is a very thumbnail sketch of what the numbers might be, but the point is, there is a huge number of them and we're pretty confident in saying that they are the single most important food item in sustaining that fishery. 
     I suspect that the big increase in stonefly numbers that we saw in 2013 plays a large role in the increased quality of the brown trout fishery in the past couple of years. I think it's possible that the huge runoff year of 2011 triggered a positive response in stonefly numbers, and now we're seeing the benefit of that. However, one could also argue that the drought year of 2012, in which we didn't see much in the way of high flows, allowed higher survival of stonefly larvae and that is the reason we saw the big number in 2013. Hard to say at this point, but these are the relationships that we're trying to nail down with a better understanding.  Unfortunately, we missed getting a count right after the hatch in 2012, hence the missing year in the data. 
     Those of you that fish there are aware that Eagle County built a new boat ramp just downstream of Bond, called Two Bridges, and this has created a new float that folks are taking advantage of, from State Bridge to Two Bridges. It's about six miles of river. The existence of that new ramp has changed traffic patterns on the river dramatically, because now float anglers can segregate themselves from the whitewater floaters upstream. There isn't much in the way of rapids on this new float, so the whitewater folks aren't using it much. But the fishing is good. So, we saw the need to add a new survey station in that reach.  I was really stoked to get a new survey station established there.  It is an exciting thing to do a fish survey in a spot where you know that you're the first people to ever scientifically document what the fish population there is. We started our station right at the highway bridge itself, and surveyed downstream for exactly two miles of river. This gives us a good, direct comparison to the radium reach. The results are in the table below:

     So the State Bridge survey revealed a fishery that is just slightly lower quality than Radium, but still pretty good. 
     Be sure to comment or email with any questions.